Contents
function testFit(desiredTest,splineSample)
Example 2
Input values desiredTest = 60, splineSample = 200;
Load in output of a desired model, fit, filter and evaluate a spline Output written into an excel data file
Defaults
if ~nargin
    desiredTest  = 60;
    splineSample = 200;
end
Finding Names of all Text Files in the ModelResults Directory
filexlsName = 'FinalResults.xls';
dirName = fullfile(pwd, 'ModelResults');
modelFiles = dir(fullfile(dirName, ['*.', 'txt']));

if isempty(modelFiles)
  error('testFitEx:NoDataFiles', ...
    'No data files.\nRun "FileGenerator.m" in the ModelResults folder');
else
  numModels = length(modelFiles);
end

disp('Processing test results...');
Processing test results...
Reading, Averaging, and Fitting all Text Files
for id = 1:numModels
Read in the Relevant Model Data
    fileName = fullfile(dirName, modelFiles(id).name);
    [tmp, modelName] = fileparts(modelFiles(id).name);
    fid = fopen(fileName);

    % Getting the number of timesteps from the header of the txt file

    nTimes = textscan(fid, '%*s %d \n', 1);
    nTimes = nTimes{1};

    % Read through models we don't want data from and keep resaving model
    % info into modelData until it gets to desiredModel

    for j = 1:desiredTest-1
        fgets(fid); % read test header line
        textscan(fid, '%*f %*f \n', nTimes); % get model output data
    end

    fgets(fid); % read test header line
    modelData = textscan(fid, '%f %f \n', nTimes); % get model output data
    modelData = cell2mat(modelData);

    fclose(fid);
Filter, Fit and Evaluate Spline on Model Data
    nPoints = 10;  % setting number of points to average over
    b = (1 / nPoints) * ones(1, nPoints);  % moving average over nPoints
    filterData = filter(b, 1, modelData); % create moving average

    splineData = spline(filterData(:, 1), filterData(:, 2)); % create spline
    splineTime = linspace(0, filterData(end, 1), splineSample);
    finalData = ppval(splineData, splineTime); % evaluate spline
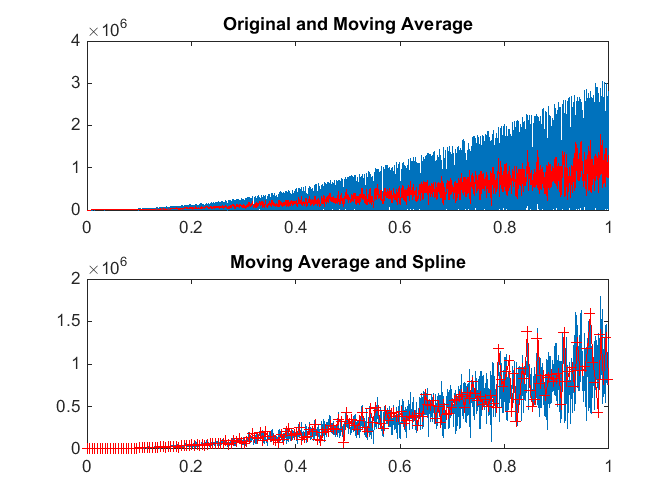
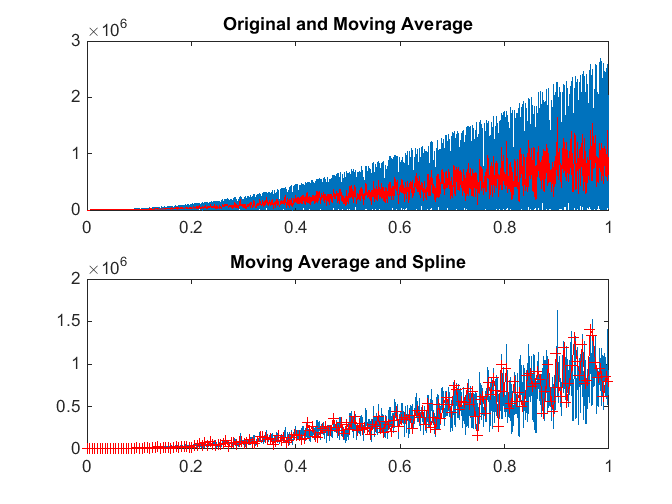
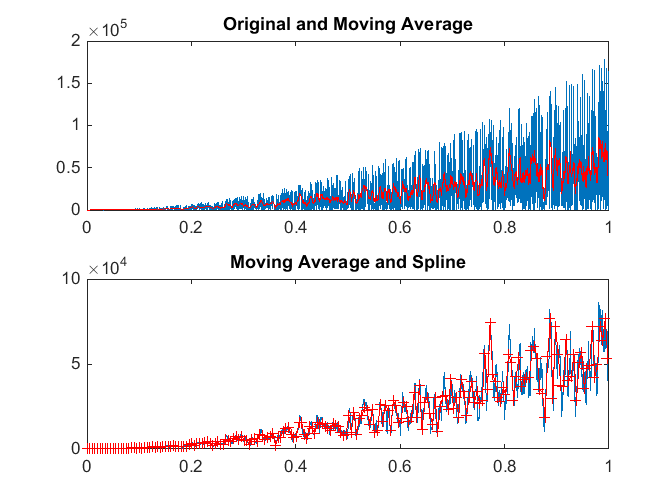
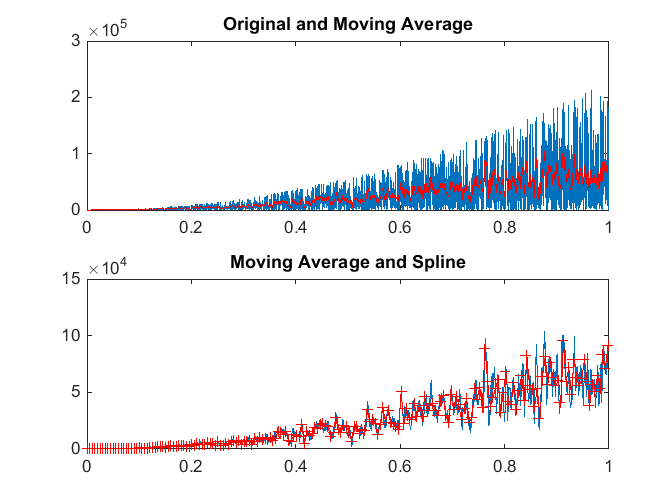
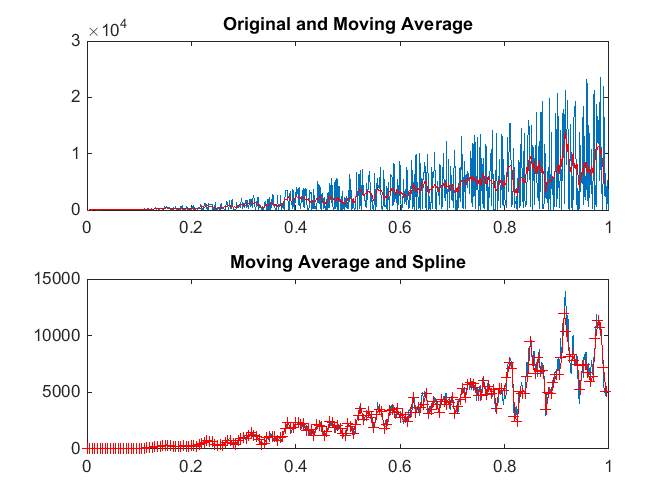
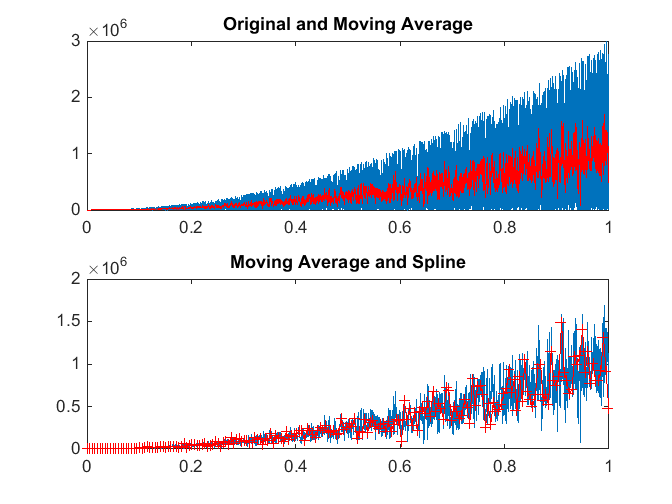
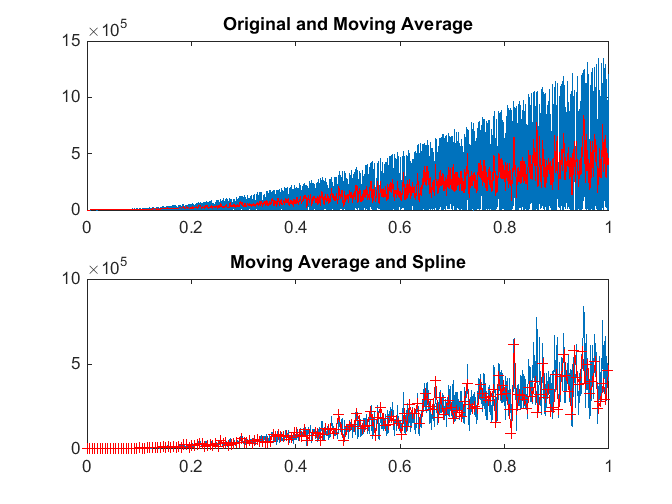
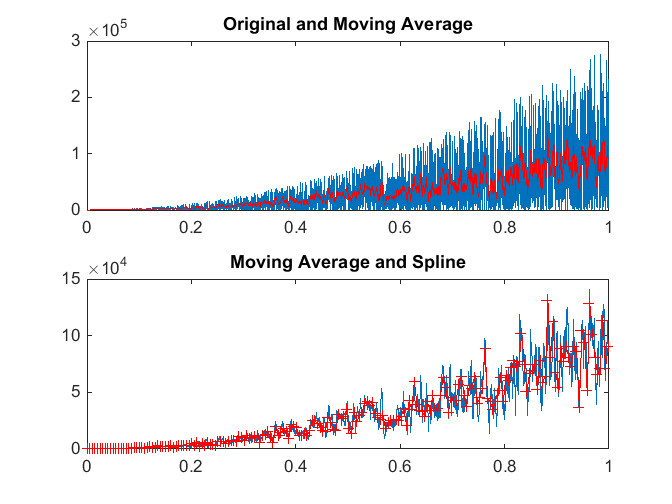
Plot the Results
    figure;

    subplot(2, 1, 1)
    plot(modelData(:, 1), modelData(:, 2));
    line(filterData(:, 1), filterData(:, 2), 'Color', 'r');
    title('Original and Moving Average')

    subplot(2, 1, 2)
    plot(filterData(:, 1), filterData(:, 2));
    line(splineTime, finalData, 'Color', 'r', 'Marker', '+');
    title('Moving Average and Spline')


    %saveas(gcf, fullfile('PlotFigs', [modelName, '.fig']));


Output Spline Results to an Excel File
    xlsPlace = sprintf('%c1:%c%d', 'A'+2*id-2, 'A'+2*id-1, splineSample);
    xlswrite(filexlsName, ...
      [{sprintf('time%03d', id), sprintf('data%03d', id)}; ...
      num2cell([splineTime; finalData]')], xlsPlace);
end

close all % close all figures