- Table of contents
- System Architecture
System Architecture
Communication Of Your High-Level System Design
System Architecture Diagrams, aka Block Diagrams, are used to communicate how ALL the pieces/subsystems/functions of your design go together to solve the problem.
- Show Major Overall System Elements / Functions
- Show Interfaces / Interconnections Between Elements
- Where Appropriate, Show Data Flow Between Elements
- Can Be Used to Show Before and After Situations
- Indicate What Is Removed, What is Added, What is Changed
- Can Show Organization of Elements
- Can Show Team Assignments
- Examples Found by Searching for “block diagram for __”
Apply to All Fields of Engineering!
It is generally difficult and confusing to show physical parts, data flow, power, user input on a single diagram. So DON'T try. Instead, use multiple sheets/slides/images to separate these diagrams.
The system architecture is an effective way to communicate which team member is working on each portion of the system. The examples below show different methods of leveraging the diagrams to include this information.
Types of diagrams
- Flow chart for software or production process or decision making
- Mechanical drawing to show interconnection of physical parts
- Schematic to show connection of electrical components
- Block diagram to show high level connection of mechanical or electrical components
Tips
- Be sure to annotate All items in the diagram that do not already have identifying information. This means descriptive words adjacent to, or with a line pointing to, the thing it references.
- Provide explanation of how system addresses the Engineering Definition of the problem
- Provide brief explanation of operation
Examples
Process Diagram
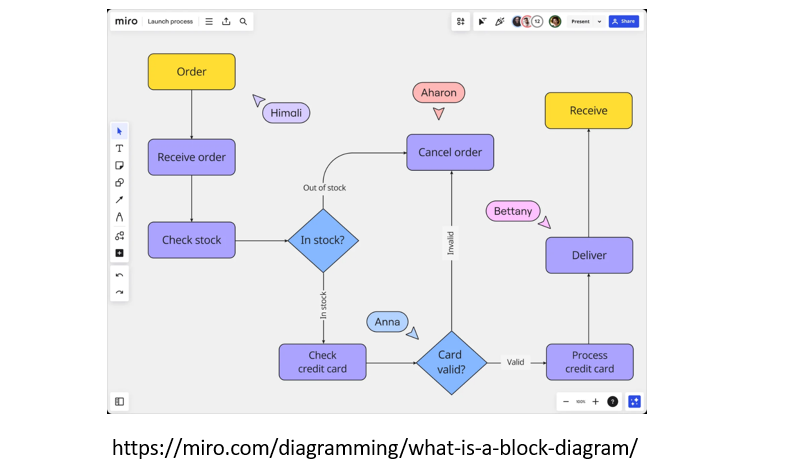
Note that in this diagram, names have been added to show ownership of each portion of the work. By using callouts (names in small shapes), the diagram itself is still easy to read. In this diagram, however, not all of the elements have such a callout, so it is unclear who, if anyone, one the team is assigned to them. You should identify items that are out of scope and thus not assigned to anyone on the team. This diagram could be improved by adding asterisks to those with a corresponding label.
Mechanical Diagram
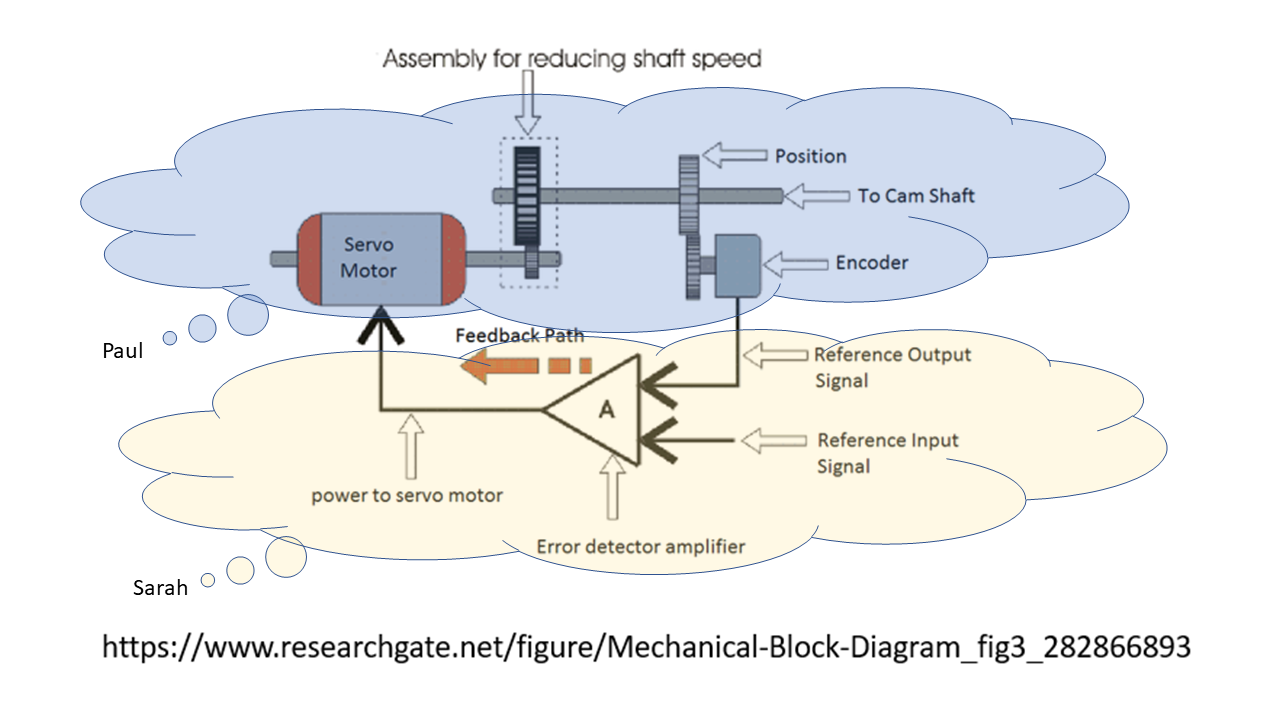
The diagram shows the interconnections within a servo motor closed loop control system. It shows that one student will be responsible for the physical mechanisms while another will be responsible for the control electronics. The work of other team members is not shown in this diagram and would need to be included on additional architecture diagrams.
Internet of Things (IoT) diagram
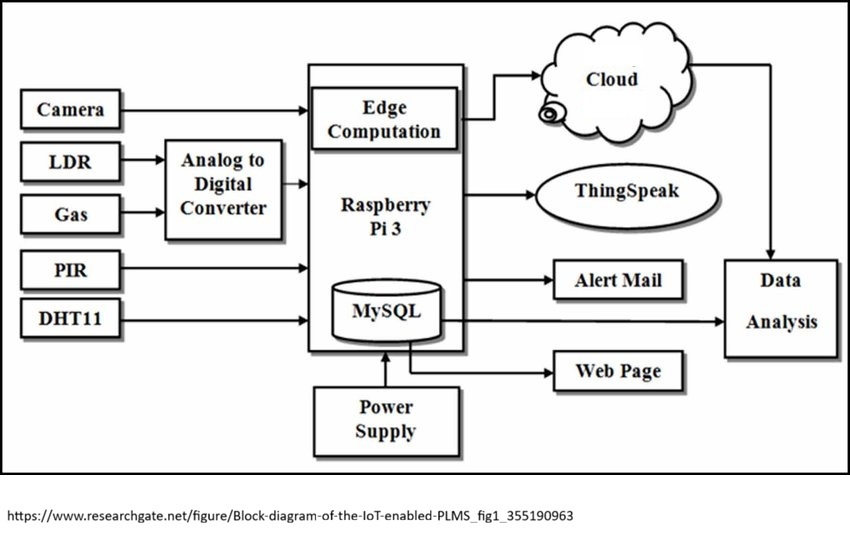
The layout of this diagram makes it challenging to add team assignments without making the diagram difficult to read. In this example, a table of assignments following the figure could be used to show the assignments as in this example. Note that color coding might be added to make the assignments clearer:
| System Component | Owner |
|---|---|
| Camera, LDR, Gas | Karen |
| PIR, DHT11 | Linda |
| Analog to Digital converter, signal processing | Daniel |
| Pi / Database, web page, mail | Michael |
| Data analysis | Sanjay |
Note that the mechanical system architecture and assignments would be shown separately.
Internet of Things (IoT) diagram
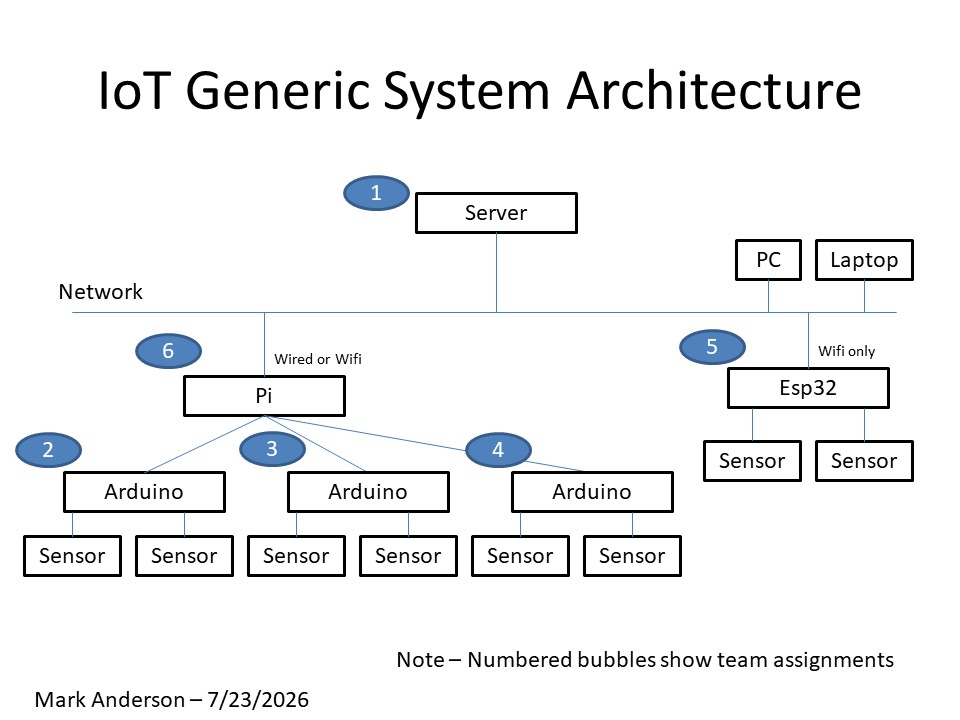
This diagram is from the Capstone Support, Internet of Things page.
The staffing assignments for this example can be shown in table format, e.g.:
| # | Owner | Subsystem Function / Purpose |
|---|---|---|
| 1 | Fred | System server for data collection and visualization including MQTT clients |
| 2 | Juan | Data collection from east side installation |
| 3 | Emily | Data collection from hydroponics |
| 4 | Greta | Data collection for energy monitoring |
| 5 | Orion | Wireless data collection from remote site |
| 6 | Carlos | Data aggregator / concentrator, MQTT server |