Classifying Human Activity Data
Human activity sensor data contains observations derived from sensor measurements taken from smartphones worn by people while doing 6 different activities (walking, lying, sitting etc). The series of measurements were run through a feature extractor to compute 561 attributes per observation. The goal of this analysis is to build a model to automatically identify the activity type given the sensor measurements.
The dataset is courtesy:
Davide Anguita, Alessandro Ghio, Luca Oneto, Xavier Parra and Jorge L.
Reyes-Ortiz. Human Activity Recognition on Smartphones using a
Multiclass Hardware-Friendly Support Vector Machine. International
Workshop of Ambient Assisted Living (IWAAL 2012). Vitoria-Gasteiz,
Spain. Dec 2012
Contents
Load Data
The data is saved in a MAT file. Each row of the variable Xtrain represents one person/instance. The corresponding row of ytrain contains the label of the activity being performed
load Data\HAData
ytraind = dummyvar(ytrain);
Visualize Data
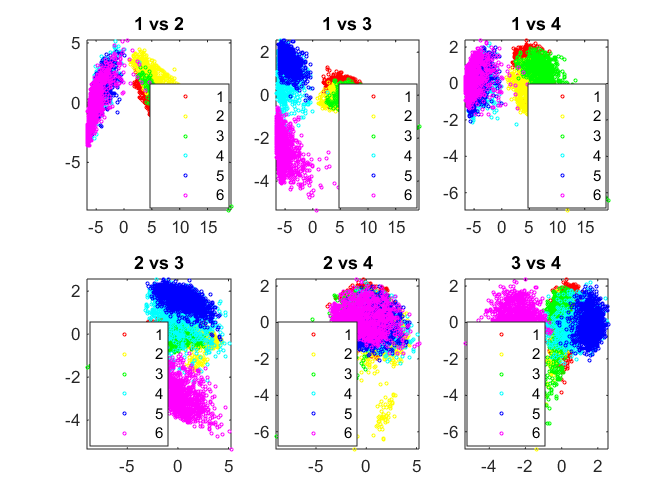
This dataset has 561 columns or variables making it a high-dimensional dataset that is inherently hard to visualize. We must therefore choose certain columns of data or reduce the number of dimensions
Principal component analysis (PCA) is one of the most popular methods of reducing the dimensionality of the data by computing orthogonal dimensions of maximum variance of the dataset. In this case, note that a few principal components capture a good portion of the variance in the dataset but that variance captured doesn't grow very fast with an increase in the number of principal components.
[coeff,score,latent] = pca(Xtrain);
pairscatter(score(:,1:4),[],ytrain);
Neural Net
The Neural Pattern Recognition tool (nprtool) provides a visual interactive method of performing this analysis. The tool can also auto-generate code such as the following
net = patternnet(15); % Initialize network

% Setup Division of Data for Training, Validation, Testing
net.divideParam.trainRatio = 70/100;
net.divideParam.valRatio = 15/100;
net.divideParam.testRatio = 15/100;

% Train the Network
rng default
net = train(net, Xtrain', dummyvar(ytrain)');
Evaluate Classifier - Confusion Matrix
One of the most straightforward way to evaluate the performance of a multi-class classifier is with a confusion matrix. The (i,j) element of this matrix shows the number (and percentage) of instances classified as class j when the true class is class i.
scoretrain = net(Xtrain')';
[~, predtrain] = max(scoretrain,[],2);
c = confusionmat(ytrain, predtrain);
dispConfusion(c, 'NNTrain', labels);

scoretest = net(Xtest')';
[~, predtest] = max(scoretest,[],2);
c = confusionmat(ytest, predtest);
dispConfusion(c, 'NNTest', labels);

fprintf('Overall misclassification rate on test set: %0.2f%%\n',...
    100 - sum(sum(diag(c)))/sum(sum(c))*100)
Performance of model NNTrain:
                                 Predicted WALKING    Predicted WALKING_UPSTAIRS    Predicted WALKING_DOWNSTAIRS    Predicted SITTING    Predicted STANDING    Predicted LAYING
    Actual WALKING               99.92% (1225)         0.08% (1)                     0.00% (0)                       0.00% (0)            0.00% (0)             0.00% (0)
    Actual WALKING_UPSTAIRS       0.09% (1)           99.81% (1071)                  0.09% (1)                       0.00% (0)            0.00% (0)             0.00% (0)
    Actual WALKING_DOWNSTAIRS     0.00% (0)            0.10% (1)                    99.90% (985)                     0.00% (0)            0.00% (0)             0.00% (0)
    Actual SITTING                0.00% (0)            0.08% (1)                     0.00% (0)                      97.36% (1252)         2.57% (33)            0.00% (0)
    Actual STANDING               0.00% (0)            0.00% (0)                     0.00% (0)                       2.84% (39)          97.16% (1335)          0.00% (0)
    Actual LAYING                 0.00% (0)            0.00% (0)                     0.00% (0)                       0.00% (0)            0.00% (0)            100.00% (1407)
Performance of model NNTest:
                                 Predicted WALKING    Predicted WALKING_UPSTAIRS    Predicted WALKING_DOWNSTAIRS    Predicted SITTING    Predicted STANDING    Predicted LAYING
    Actual WALKING               98.99% (491)          0.20% (1)                     0.81% (4)                       0.00% (0)            0.00% (0)             0.00% (0)
    Actual WALKING_UPSTAIRS       4.46% (21)          94.90% (447)                   0.42% (2)                       0.00% (0)            0.21% (1)             0.00% (0)
    Actual WALKING_DOWNSTAIRS     0.71% (3)            6.43% (27)                   92.86% (390)                     0.00% (0)            0.00% (0)             0.00% (0)
    Actual SITTING                0.00% (0)            0.41% (2)                     0.00% (0)                      87.17% (428)         12.42% (61)            0.00% (0)
    Actual STANDING               0.00% (0)            0.00% (0)                     0.00% (0)                       3.01% (16)          96.99% (516)           0.00% (0)
    Actual LAYING                 0.00% (0)            0.00% (0)                     0.00% (0)                       0.00% (0)            0.74% (4)            99.26% (533)
Overall misclassification rate on test set: 4.82%
Feature Importance
The complexity of the model and its likelihood to overfit can be reduced by reducing the number of features included. A metric like a paired t test can be used to identify the top features that help separate classes. We can then investigate whether a model trained using only these features can perform comparably with a model trained on the entire dataset
[featIdx, pair] = featureScore(Xtrain, ytrain, 20);

redF = unique(featIdx(:));
XtrainRed = Xtrain(:,redF);
XtestRed = Xtest(:,redF);
Train network on reduced feature set
netRed = patternnet(15); % Initialize network
netRed.divideParam.trainRatio = 70/100;
netRed.divideParam.valRatio = 15/100;
netRed.divideParam.testRatio = 15/100;
rng default
netRed = train(netRed, XtrainRed', dummyvar(ytrain)');

scoretest = netRed(XtestRed')';
[~, predtest] = max(scoretest,[],2);
c = confusionmat(ytest, predtest);
dispConfusion(c, 'NNTestRed', labels);

fprintf('Overall misclassification rate on test set: %0.2f%%\n',...
    100 - sum(sum(diag(c)))/sum(sum(c))*100)
Performance of model NNTestRed:
                                 Predicted WALKING    Predicted WALKING_UPSTAIRS    Predicted WALKING_DOWNSTAIRS    Predicted SITTING    Predicted STANDING    Predicted LAYING
    Actual WALKING               98.39% (488)          0.40% (2)                     1.21% (6)                       0.00% (0)            0.00% (0)             0.00% (0)
    Actual WALKING_UPSTAIRS       5.31% (25)          92.78% (437)                   1.91% (9)                       0.00% (0)            0.00% (0)             0.00% (0)
    Actual WALKING_DOWNSTAIRS     1.67% (7)            6.43% (27)                   91.90% (386)                     0.00% (0)            0.00% (0)             0.00% (0)
    Actual SITTING                0.00% (0)            0.61% (3)                     0.00% (0)                      84.32% (414)         15.07% (74)            0.00% (0)
    Actual STANDING               0.00% (0)            0.19% (1)                     0.00% (0)                       5.83% (31)          93.98% (500)           0.00% (0)
    Actual LAYING                 0.00% (0)            0.00% (0)                     0.00% (0)                       0.00% (0)            0.00% (0)            100.00% (537)
Overall misclassification rate on test set: 6.28%